Quote:
Originally Posted by pilot4fn

Trying to understand more about fuel trims... then again, in my car the idle is spot on, so hopefully highjacking the thread causes no hassle here...
This image here is from FlatSix / Jake Raby video and those figures look to be very much uniform:

This image below is from my car (2001 986 with 2.7) and the figures are way off compared to above FlatSix values:
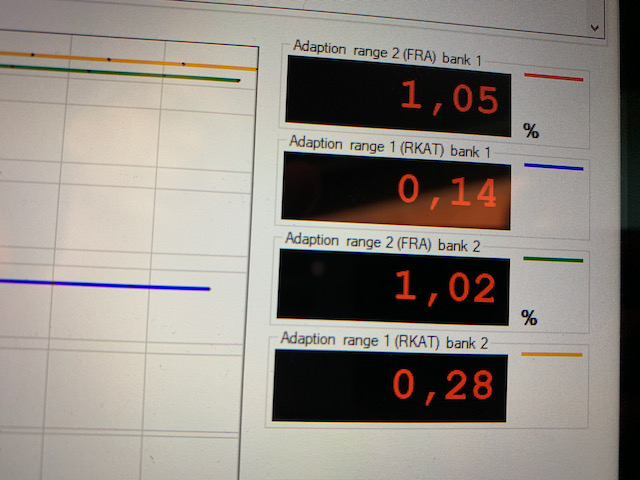
Are my car's injectors shot or something else there messed up? The car runs nice and has not issues for loss of power not anything else. What can cause such different values that whet Jake Raby's figures show?
All help is most appreciated  |
First you are comparing dissimilar data.
The Raby info is for Adaptation Range 2 (FRA-FRAU) for banks 1&2
Your info is for Adadaptation range 1 and adaptation range 2 (FRA RKAT) for banks 1&2.
Your comparing apples to oranges.